Day 3, part 2: Objective Functions and Sensitivity Analysis
In this section, we'll make our first objective function, and measure the change in NFkB concentration to all parameters. To solve this problem, we're computing

by setting our objective function

and computing

Contents
Construct the objective function
KroneckerBio includes a variety of objective functions for sensitivity analysis and optimization.
All have a similar structure: for their first argument they take the model of interest; for the second argument they take the index (or indices) of the species/outputs to use in th objective function.
Any additional information (the time at which to compute the sensitivity, or the data to compare the model's output to) is passed as the third argument.
Here, we'll construct an objective function that measures the value of the output at the time of the first event.
obj = constructObjectiveOutputValue(m, 1, simulation.te(1));
Running sensitivity analysis
Now that we have defined an objective function, let's run sensitivity analysis on the model. "Sensitivity analysis" is just a euphemism for computing the full derivatives of the objective function with respect to parameters (and/or initial conditions).
[O dOdp] = sensitivity(m, obj, expt);
Two ways to view the results of sensitivity analysis
dOdp is a list of sensitivities with one entry per parameter. First, let's make a bar graph to visualize all the sensitivities.
bar(dOdp)
xlabel('parameter index')
ylabel('dO/dp')
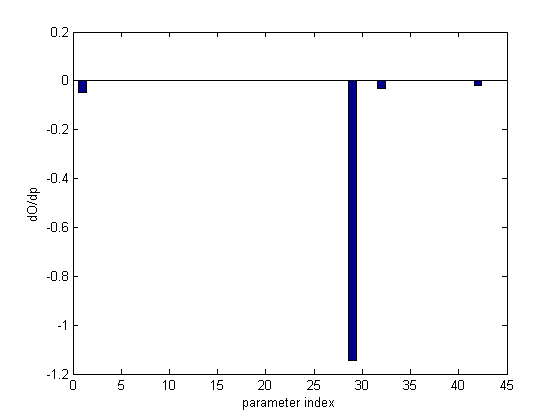
We've also included a tool that allows you to quickly look up the names, values and sensitivities of your parameters.
rankSensitivities(m, dOdp, 10)
Param #		Name			Value			dGdp
-------		----			-----			----
  29		k01  		    8e-005		     -1.15
   1		tr1  		  0.000408		    -0.047
  32		tp1  		   0.00015		   -0.0301
  42		DNAprod		     0.001		   -0.0191
  28		k1   		      0.09		   0.00168
  19		d4   		    0.0005		   0.00085
  31		deg4 		 2.25e-005		  0.000742
   6		tr3  		   0.00028		  0.000299
  30		deg1 		  0.000113		  0.000288
  34		k2   		    0.0138		 -0.000261
To try on your own
Do these results hold up for other peaks?
Try running the analysis from Parts 1 & 2 on different oscillation peaks, and see what kind of parameter ranked list you get. If you want, increase the number of events for which you're simulating. Do the same parameters appear to control all pulse heights?