Contents
Load my model
dataModel = loadModel('OneStep');
Simulatate our "real model"
we use the nominal model to generate some data
exp1 = constructExperiment(30*60, 10);
data = simulate(dataModel, exp1);
Scramble the parameters onthe model
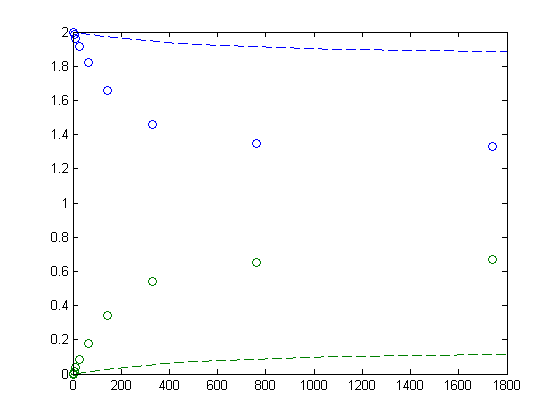
m   = dataModel;
m.p = m.p.*random('log',0,1,size(dataModel.p));
m   = postProcessModel(m);

beforeFit = simulate(m, exp1);

tData = [0, logspace(0, log10(29*60), 10)];
myData.y = data.y(tData);
myData.t = tData;


% Plot the data and the model before the fit on the same axis
figure(1),clf
plot(myData.t, myData.y, 'o'); hold on;
drawnow;
plot(beforeFit.t, beforeFit.y(beforeFit.t), '--'); hold off;
disp('Hit any Key to continue'); pause;
Hit any Key to continue
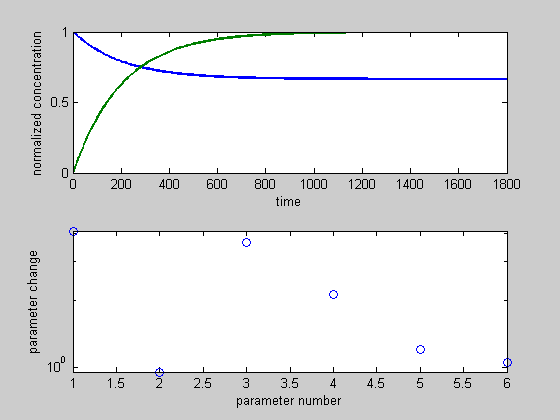
Fit the new model to data generated from the old model
figure(2),clf
obj = constructObjectiveOutputSSE(m, 1:m.nY, myData);
[mFit,G] = fitParameters(m, obj, exp1);
afterFit = simulate(mFit, exp1);
                                max     Line search  Directional  First-order
 Iter F-count        f(x)   constraint   steplength   derivative   optimality Procedure
    0      1      1.98765    -0.008716
    1      3     0.758514     -0.01118        0.001    -1.1e+003          500
    2      5     0.118325     -0.01096       0.0202        -12.3          671
    3      7    0.0151471     -0.02127        0.116        0.208         17.1
    4     13    0.0148912      -0.0226       0.0115       0.0277         9.28
    5     17   0.00107799     -0.02495       0.0149        0.552         2.02
    6     19  0.000161612     -0.02434            1    -0.000466        0.625
    7     21 4.07612e-005     -0.02388            1    3.21e-005        0.101  Hessian modified
    8     23 3.88479e-005     -0.02391            1    4.83e-008      0.00492  Hessian modified
Optimization terminated: magnitude of directional derivative in search
 direction less than 2*options.TolFun and maximum constraint violation
  is less than options.TolCon.
No active inequalities.
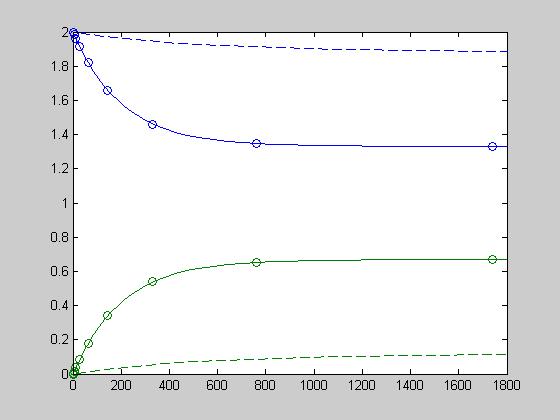
Plot the results
figure(3),clf
plot(myData.t, myData.y, 'o'); hold on;
plot(beforeFit.t, beforeFit.y(beforeFit.t), '--');
plot(afterFit.t, afterFit.y(afterFit.t), '-');
hold off;